Representations
How do representations help students learn?
Which problem intrigues you more, (a) or (b)?
a. 10 x 10 x 10 = _______
b. How many small blocks are in this large block? How did you figure that out?
a. 10 x 10 x 10 = _______
b. How many small blocks are in this large block? How did you figure that out?

(Image from: http://www.mathatube.com/place-value-models.html)
My guess is that (b) caught your attention before you tried to answer (a). At least, that’s what happened for me. Notice that both problems can involve multiplying 10 x 10 x 10, and the answer is the same. BUT (a) can be completed with simple memorization or use of an algorithm, while (b) requires the student to think about it. This is why representation is so important for me and also for elementary school students.
The concept of representation (one of the Process Standards on the ELED 433 Mathematical Concepts chart) intrigues me because having a model that I can see and/or touch is very helpful for me to learn. I love how concepts can be represented visually and tangibly. The alternative is simply word and number form, and those can get quite boring and lose my attention fast.
Likewise, children are very visual and don’t have the attention span to read about something in a paragraph. They want a picture or model, such as the example above, or interactivity that provides a better picture in their heads of the concept being taught.
There are two mathematical concepts (under process standards) that relate to representation. The first is visualization. A representation is basically a model that gives you a clear mental image of the concept. In order to do this, you must visualize your idea of that concept in order to produce a model. Going through this process helps students make connections among concepts on their own.
The second concept is problem solving. Through interpreting or creating a representation, students can practice problem-solving skills. It is very helpful to create some type of representation in order to solve a problem rather then struggle through a process of writing and making sense of information from numbers. A simple representation will help you synthesize all that information as well as remember it.
Representation is very important to mathematical content because when you present information using a representation, it engages the students and gets them to think about the concept in a different way. Teachers can use representations to organize, record, and communicate mathematical ideas, and also to model how to solve a problem.
Students learn the mathematical process when you take this a step further by having them create their own representation. This way, they will more likely remember it. For example, if a student writes the problem 43 x 2 = 86, and goes through the algorithm of multiplying and putting numbers in the right place, he still might just be going through the motions and not understand what is really happening with those numbers. But imagine the student ALSO drawing pictures of manipulatives (two groups that each have 4 ten-rods and 3 individual pieces). That use of representation would show much more clearly how he thought through the problem.
Representations should really be used in every subject, not just math. They relate to Social studies in several ways, including maps. In order to use a map, students need to understand directions (N, S, E, W), sun and star navigation, compasses, keys, scales, units of measurement, etc. A maps is a wonderful visual representation that is very interactive and applies many math skills such as using a grid and distance measurements. Maps also tie in to geography, because you can have a map of any place in the world. Children need to become familiar with the countries of the world and where they are on a map, and also the different states of America.
Another way representations connect to social studies is that there are many math activities developed around the world. As discussed in Multicultural Math, there are many different problem-solving strategies developed in other countries that are visual models. Some examples are hand signals used by the Indians of the Great Plains (one for each number), the abacus, and Native American beadwork patterns. Teaching these strategies will promote cultural awareness in your classroom while also introducing hands-on and visual problem-solving strategies.
When teaching literacy, you can use representations a lot in reading comprehension. You can have children read the story then draw a picture of what happened, or make an outline of the story. You can also form a list as a class of the setting, characters, plot, etc. These kinds of things will help the students actually process what they read, rather than just hearing it and moving on.
You can also use visual representations to teach phonics and grammar. For example, my cooperating teacher puts note cards in the pocket chart when teaching a certain concept like “silent e.” She will put a note card at the top saying “a_e”, then underneath that, words such as “late, skate.” Then she will make a second column with another note card saying “o_e”, then underneath that, words such as “code, hope.” These visuals representations are interactive and allow the students to pick them up and put them in the correct column.
Also, with literacy, picture books can themselves serve as visual representations for other subject content. Still Another Number Book (by Chwast & Moskof) is a picture book that goes through and counts to 1, then to 2, then to 3, etc. until you count all the way to 10. Each time there are things you are counting, such as butterflies or dogs, and on the page, there is a +1 above each thing being counted. At the end of a counting set, it says =5, or whatever the total is. The pictures are very colorful and engaging, and it is a great way to tie literacy and patterns into number sense. The book serves as a representation for the mathematical concept of addition.
Of all the subjects, science is the one where I would expect the most representations. These include DNA, atom structure, science experiments, charts on the wall, life cycles, plant structure, etc.
Technology also has many uses for representations, many of which fall under science. In Mathematics for Elementary Teachers, Musser introduces the process of “Clock Arithmetic.” I had never heard that term before, but if you think about it, a clock is a physical and visual representation of a system of number patterns. Most math deals with infinite sets of whole numbers, but some technologies, including clocks, use a finite set of numbers (12 hours, 60 minutes per hour, 60 seconds per minute). The chapter explains how to write and solve different clock arithmetic problems, such as, “If it is 7 o’clock, what time will it be in 8 hours?” You would write that as 7 8 = 3. The is a circled plus sign, indicating that since you have to go around the circle of the clock, you start over at 12. So the calculation would be: 7 + 8 – 12 = 3 o’clock.
Physical education is, of course, very active. So you need to be able to be able to visualize what is going to happen. When the teacher explains a new game, or the coach explains a new play, he may use a diagram to show everyone what he means. I played basketball in high school, so I put an example of a play below. It shows #3 passing the ball inbounds to #5, who can then pass it to any of the other players who are meanwhile cutting back and forth.
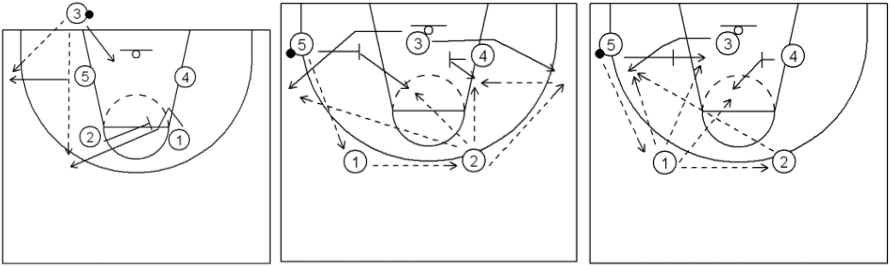
(Image from http://www.coachingtoolbox.net/plays/diagrams/basketball-plays-choice-zone-inbounds.htm)
And finally, the arts use many visual representations. You could say that art is a necessary skill in order to make most representations. As will be discussed in my resources, tessellations are an intriguing category of patterns. they can help students learn the concepts of infinity, repeating patterns, and geometric grids.
You could also say that music is an art. I remember a lot of things simply because I know a song/rhyme/acronym for it. I know my states from the Troxel Geography Songs (which incorporate map representations). I remember early Mediterranean history from a history song my class learned in 3rd grade (which we sang while looking at the cards posted on the wall, each having the event and a related picture). I know the rainbow colors from “Roy G. Biv” (which incorporates representation by the colors of the rainbow). I know the alphabet from the alphabet song. I also learned a lot from School House Rock, which has different series on math, science, American history, and grammar (each video has animations that go along with each song).
Finally, for art, I remember using the color wheel below. It is a clear representation of which colors are primary, secondary, and tertiary.

(Image from http://www.thegnomonworkshop.com/news/wp-content/uploads/2013/07/color-wheel-colors-31651206-500-489.jpg)
Sources for the standards:
http://www.corestandards.org/math
http://www.doe.virginia.gov/testing/sol/standards_docs/mathematics/2009/stds_math.pdf
http://www.cssu.org/cms/lib5/VT01000775/Centricity/Domain/32/CSSUMathCurricMay04.pdf
http://www.corestandards.org/math
http://www.doe.virginia.gov/testing/sol/standards_docs/mathematics/2009/stds_math.pdf
http://www.cssu.org/cms/lib5/VT01000775/Centricity/Domain/32/CSSUMathCurricMay04.pdf
Resources
Books
· Multicultural Math: Hands-on activities from around the world, for grades 3-6 (Claudia Zaslavsky). This book explores many different problem-solving strategies used around the world. Many of them are visual models, such as making a table, hand signals used by the Indians of the Great Plains, the abacus, Native American Beadwork, etc. These ideas will promote cultural awareness while also introducing hands-on and visual problem-solving strategies.
· Math for the very young: a handbook of activities for parents and teachers (Polonsky, Freedman, Lesher, & Morrison). This book describes many different ways to teach math concepts to PreK-2 children through every day activities: around the house (growing plants, cooking, keeping time), growing (body measurements, teeth), calendar math, on the move (at the zoo, playground, store), crafts (weaving, drawing, pillows), and games (card, counting, dice, guessing, and outdoor games).
· Still Another Number Book (Chwast & Moskof). This is a picture book that goes through and counts to 1, then to 2, then to 3, etc. until you count all the way to 10. Each time there are things you are counting, such as butterflies or dogs, and on the page, there is a +1 above each thing. At the end of a counting set, it says =5, or whatever the total is. The pictures are very colorful and engaging, and it is a great way to tie literacy and patterns into number sense.
· Sir Cumference and the Sword in the Cone (Neuschwander & Geehan). This series uses stories of King Arthur and his knights to teach math principles. In this book, they try to find a sword using math principles. This series can be used in the classroom to introduce new principles in a unit, or review them in a fun way. (http://www.goodreads.com/book/show/789984.Sir_Cumference_and_the_Sword_in_the_Cone)
· Zero the Hero (Holub & Lichtenheld). In this picture book, the character Zero feels worthless. But throughout the story, he learns how useful his talents are. This book is a great way to introduce how zero fits into the rest of the numbers. (http://www.goodreads.com/book/show/12071060-zero-the-hero)
Art/Visual
· Maps & Mazes (Chapman & Robson). This book also teaches the map skills listed above, but with a more artistic focus, including how to design a pebble maze or compass rose, and reading signs.
· The picture below (from http://theelementarymathmaniac.blogspot.com/2013/07/place-value-decks-numbers-0-120.html) is an example of using manipulatives to teach place value. The visual (either on paper or as manipulatives) really helps them picture what each digit represents.

· Software called Conceptuamath can be used to visually represent a fraction. This is a lot easier for a child to understand than simply the fraction alone.
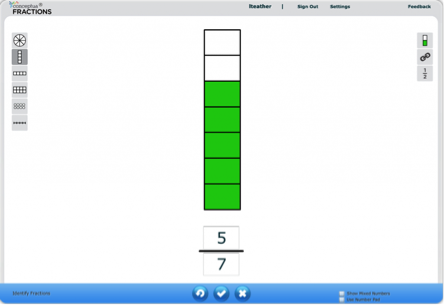
(Image from http://www.coetail.com/laurenteather/2011/10/09/making-math-visual/)
· Tessalations. These are a really intriguing category of patterns. They are shapes that fit together and keep repeating. These images can help with the concept of infinity, repeating patterns, and geometric grids.
· Tessalations. These are a really intriguing category of patterns. They are shapes that fit together and keep repeating. These images can help with the concept of infinity, repeating patterns, and geometric grids.
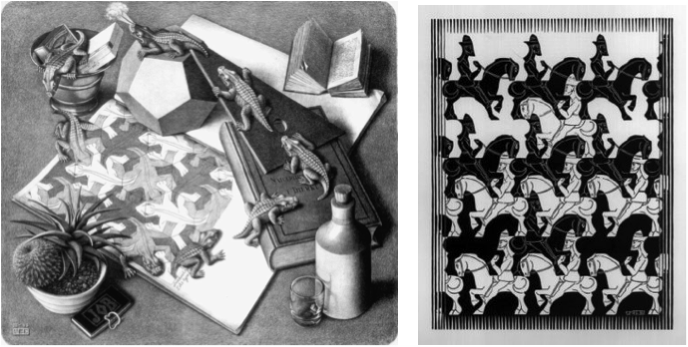
(These drawings by M.C. Escher are from http://brettworks.com/2012/04/26/on-the-musicality-of-m-c-escher/)
· Cartoons relating to the right math topic are a great way to get students’ attention at the beginning of class! Also a great way to recap from the day or week before, because of how engaging the visual representation is.
· Cartoons relating to the right math topic are a great way to get students’ attention at the beginning of class! Also a great way to recap from the day or week before, because of how engaging the visual representation is.
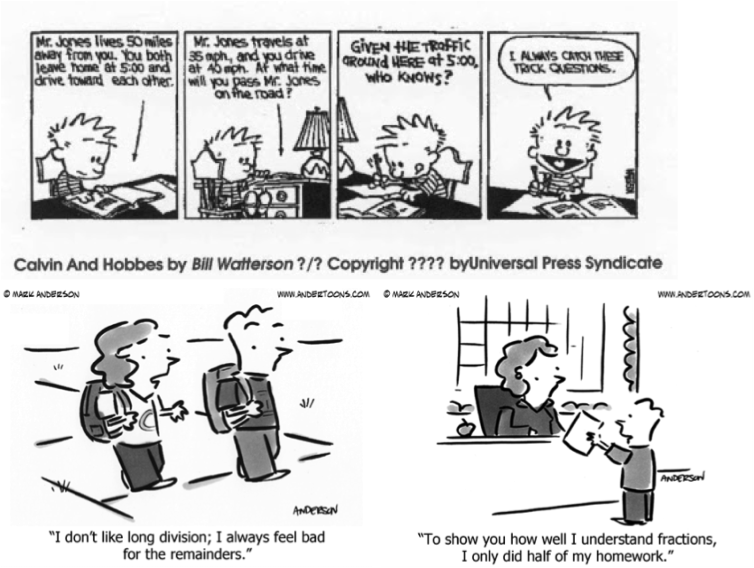
(Images from https://sites.google.com/site/kawojtak/stuff-of-interest/anotherpost & http://www.andertoons.com/cartoon-blog/2012/08/teacher-cartoons-2.html)
Games (physical, internet-based, apps)
· Brain Pop (http://www.brainpop.com & Brain Pop Jr. (http://www.brainpopjr.com/). These websites contain all sorts of interactive games and videos, for all different subjects. Some require a login, but many are free. One good example was a game called “Dublox.” This came consists of a plane made out of cubes suspended in the air, and you have a set of 4 cubes that you need to get from one starting point to the other. It was actually quite fun for me, and I couldn’t get past level 7. It helps kids visualize a graph and planes, and helps them with surface area and spatial awareness.
· Bechained is a free game app. It is similar to Tetris, but the shapes are different colored jewels, and you draw a line on all the like colored jewels that are touching.
· http://www.kidsmathgamesonline.com has lots of interactive games, many of which use representation, such as the Percentage Game, an interactive game that teaches kids about percentages. It gives you a grid of 100 squares and instructions that involve planning a park with a range of different features (grass, water, woodland, flowers and playgrounds). The instructions for each round tell you what percentage each park feature should cover. Tasks then become more difficult and begin to use decimals instead of percentages. You see the map laid out on the screen. (http://www.kidsmathgamesonline.com/numbers/percentages.html)
· www.sheppardsoftware.com has a lot of helpful math games, including a Decimal Modeling Game. In this game, the player has to match a decimal with its pictorial representation. (http://www.sheppardsoftware.com/mathgames/decimals/DecimalModels10.htm)
· www.primarygames.com is another website full of educational games, including Mathepillar, in which the player has to arrange the numbers 1-10 in order on the segments of a caterpillar. This is good for teaching Ordinality to preschoolers and kindergarteners.
Media (songs, movies, TV shows, websites)
· Geography songs, by Larry & Kathy Troxel. There are a lot of geography songs out there, but these are the best, in my opinion. They cover the US states and state capitals, and all the continents and countries. The only online recording I could find is this YouTube video: http://www.youtube.com/watch?v=Yy4HPMzdwec. Unfortunately, it is not the best quality. I have the cassette tape, and it came with a workbook that includes the song lyrics, a map of each area to color in, some other fill-in-the-blank activities. When my siblings and I were little, we would beg my mom to play these songs for us, and we used them as part of my class curriculum in 4th grade. I still use the states songs to remember the US states. As mentioned above, map skills use a lot of math concepts, and becoming familiar with the world map is a very important part of education.
· Bill Nye the Science Guy. He makes fun videos for kids about different science topics. As we all know, math is the language of science, so math always shows up in science somehow. For example, in this video on electricity, http://www.youtube.com/watch?v=cEodi7OtQZg, math is used when considering the number of protons and electrons in an atom. Bill Nye is very good at making everything fast-paced and visually stimulating. This is much more effective than reading a paragraph about electricity.
· School House Rock has lots of different songs on math, science, and grammar. This video (http://www.youtube.com/watch?v=cZ4qjYOixAg) represents multiplication with animals. This is very helpful for multiplication, which can be a confusing operation for students learning it for the first time.
· If you are going into more depth about the concept of infinity, this video may be helpful and engaging. https://www.youtube.com/watch?v=elvOZm0d4H0#t=157. I would probably show it to 5th or 6th graders or older. The number lines and all that he draws on his big sheet of paper are great representations of what he is talking about, and much more effective than simply talking about infinity.
· Video on Japanese Multiplication: https://www.youtube.com/watch?v=85Vd0NpL32k#t=60. I thought this was a really cool way to represent multiplication in a new way, especially for kids who are struggling with the process you teach them. I would not show the whole thing to younger children, but I could show the whole thing to older kids, such as 5th & 6th grades.
Non-fiction (current events/interdisciplinary connective sources)
· Every Day Counts Calendar Math (Gillespie & Kanter). This is a box full of resources that help teach math skills through a calendar. It lays out a schedule of different topics throughout the year: multiples and patterns, daily depositor (a poster with a column for each place value: ones, tens, all the way to millions), daily decimal, graph data from an experiment, fraction of the day, arrays, clock problems, measurement activities, coin counter, full and blank 100’s charts, a roll of receipt tape for making a number line, etc. Available for grades K-5.
· Math Trailblazers, teacher resource CD-ROM, grade 2. Contains blackline masters, transparencies, math facts calendar, facts distribution, math facts games, addition and subtraction review, etc. The blackline masters would be helpful for a teacher to show students visuals in class during a lesson.
· enVisionMath Virginia (Scott Foresman-Addison Wesley). Available for grades K-6 in the form of a student lesson packet or a student tablet. Posters/worksheets that are designed after each individual math SOL. For K-2, it has things like counting backward fill-in-the-blanks, color/shape patterns illustrations and activities, dividing things into equal parts, etc.
· wps.ablongman.com/ab_vandewalle_math_6/0,12312,3547876-,00.html This is a compilation of blackline masters to use in class. These are great simple visuals including dot cards, assorted shapes, square and dot grids, etc. These representations can help kids picture the quantity of the number rather than just read/write the number symbol.
· http://www.mathcats.com/ is a resource for parents and teachers full of crafts, projects, games, and more to assist with math instruction. Some projects I liked were: number city, symmetrical butterflies, 21-point thread design, and graph your own math cat. These projects help kids take home a tangible representation of what they learned about in class.
Community-based (guest speaker, field trip)
· You could invite a local post office worker/mailman to come in as a guest speaker and explain all the math behind the postal system (zipcodes, street numbers, how they organize letters, etc.). Or your class could learn those things on a field trip to the post office.
· Another good field trip/guest speaker would be the library. The librarians could explain how they order books on the shelves using the Dewey decimal system.
